Steer today, not on last month's figures
Finance, people, sales, payroll and projects together in one management view. You see not only how you stand, but also why, who is responsible and what the next step is.
No separate dashboards and reports that always arrive too late. One steering cycle: goal, current figures, explanation, owner and action.

“The EBITDA margin is 1.4 points above target, but the Q4 weighted pipeline is below target. Without new closings, the revenue dip will carry over into January.”
Your figures are up to date, not a month old.
Revenue, margin, cash, utilization, and absenteeism come directly from your administration, HR, payroll, and CRM. You don't have to wait for the month to close or for someone to update an Excel file. You see where you stand right now.
You don't just see what is off, but also why.
If a figure deviates from your target, you click through to the source. Is it due to a customer who pays later, a team with high absenteeism, or a project that is running over? You see it all at once, without anyone having to investigate it first.
Every deviation has an owner and an action.
A figure that doesn't add up becomes a task for the right person. You see who is responsible and how things stand. This way, a management meeting doesn't get stuck talking about the numbers, but focuses on decisions.
Nora signals, you decide.
Nora, the AI assistant in Nexora, continuously monitors all your KPIs. She not only sees when a figure deviates, but also identifies connections that you might miss in separate reports. For example, that your margin looks good, but your pipeline is too thin to generate the same revenue in the new year. She prepares the report for you, with explanation and a proposal for the next step. You or your management team decides. Driving your business requires choices that only you can make, so Nora prepares and a human determines what happens.
More about Nora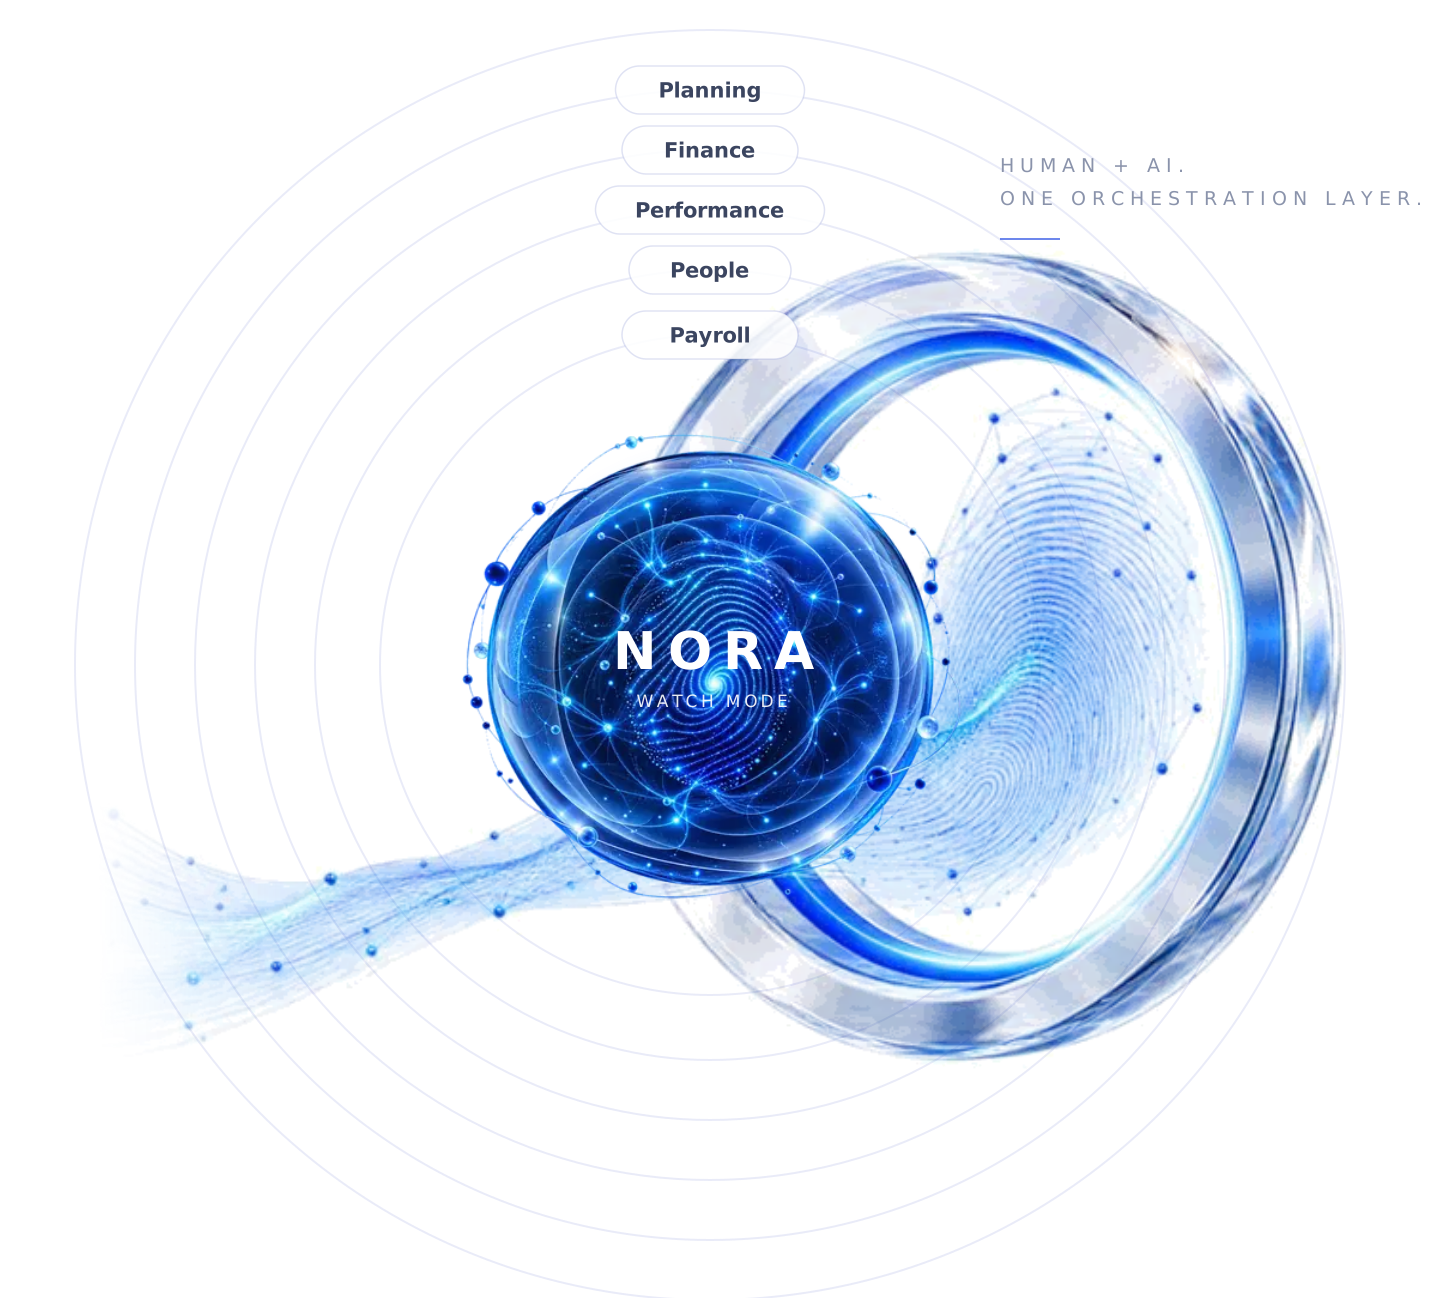
Nexora's Control Tower module
KPIs & targets
Set your goals, targets, and owners for each component. You immediately see what is on track and what needs attention, without scrolling through ten tabs.
Management reporting
Nora generates a conceptual report from your current figures, including variances and explanations. You review, supplement, and share. No more late nights spent gathering figures.
Forecast & scenarios
Plan ahead for cash, revenue, capacity, and margin based on the same real-time data. What happens if that big deal falls through, or if you hire two people? You see it before you decide.
Navigate to the source
Click directly from a deviating number to where it originates: an invoice, a team, a project, or a customer. You'll know within a minute where the issue lies.
Actions & follow-up
Every variance becomes an action with an owner and a deadline. In the next meeting, you'll immediately see what has been done and what remains open.
Discover what else Nexora can do.










A strong quarter, and a clear view of what comes next
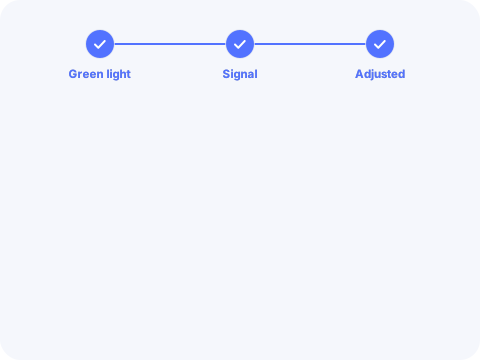
Things are going well. Revenue is 9% higher this month than last year, and margins are above your target. In a standard monthly report, you get the green light and keep going. What you don't see: there aren't enough deals in the pipeline to maintain that pace. In Nexora, Nora highlights that connection. She sees that the weighted pipeline for the fourth quarter is below your standard and calculates that without new deals, the revenue dip will continue into January. The signal reaches you and your sales manager, complete with the figures and the cause. You decide to ramp up acquisition, as there is still time to adjust.
Your company at a glance, wherever you are
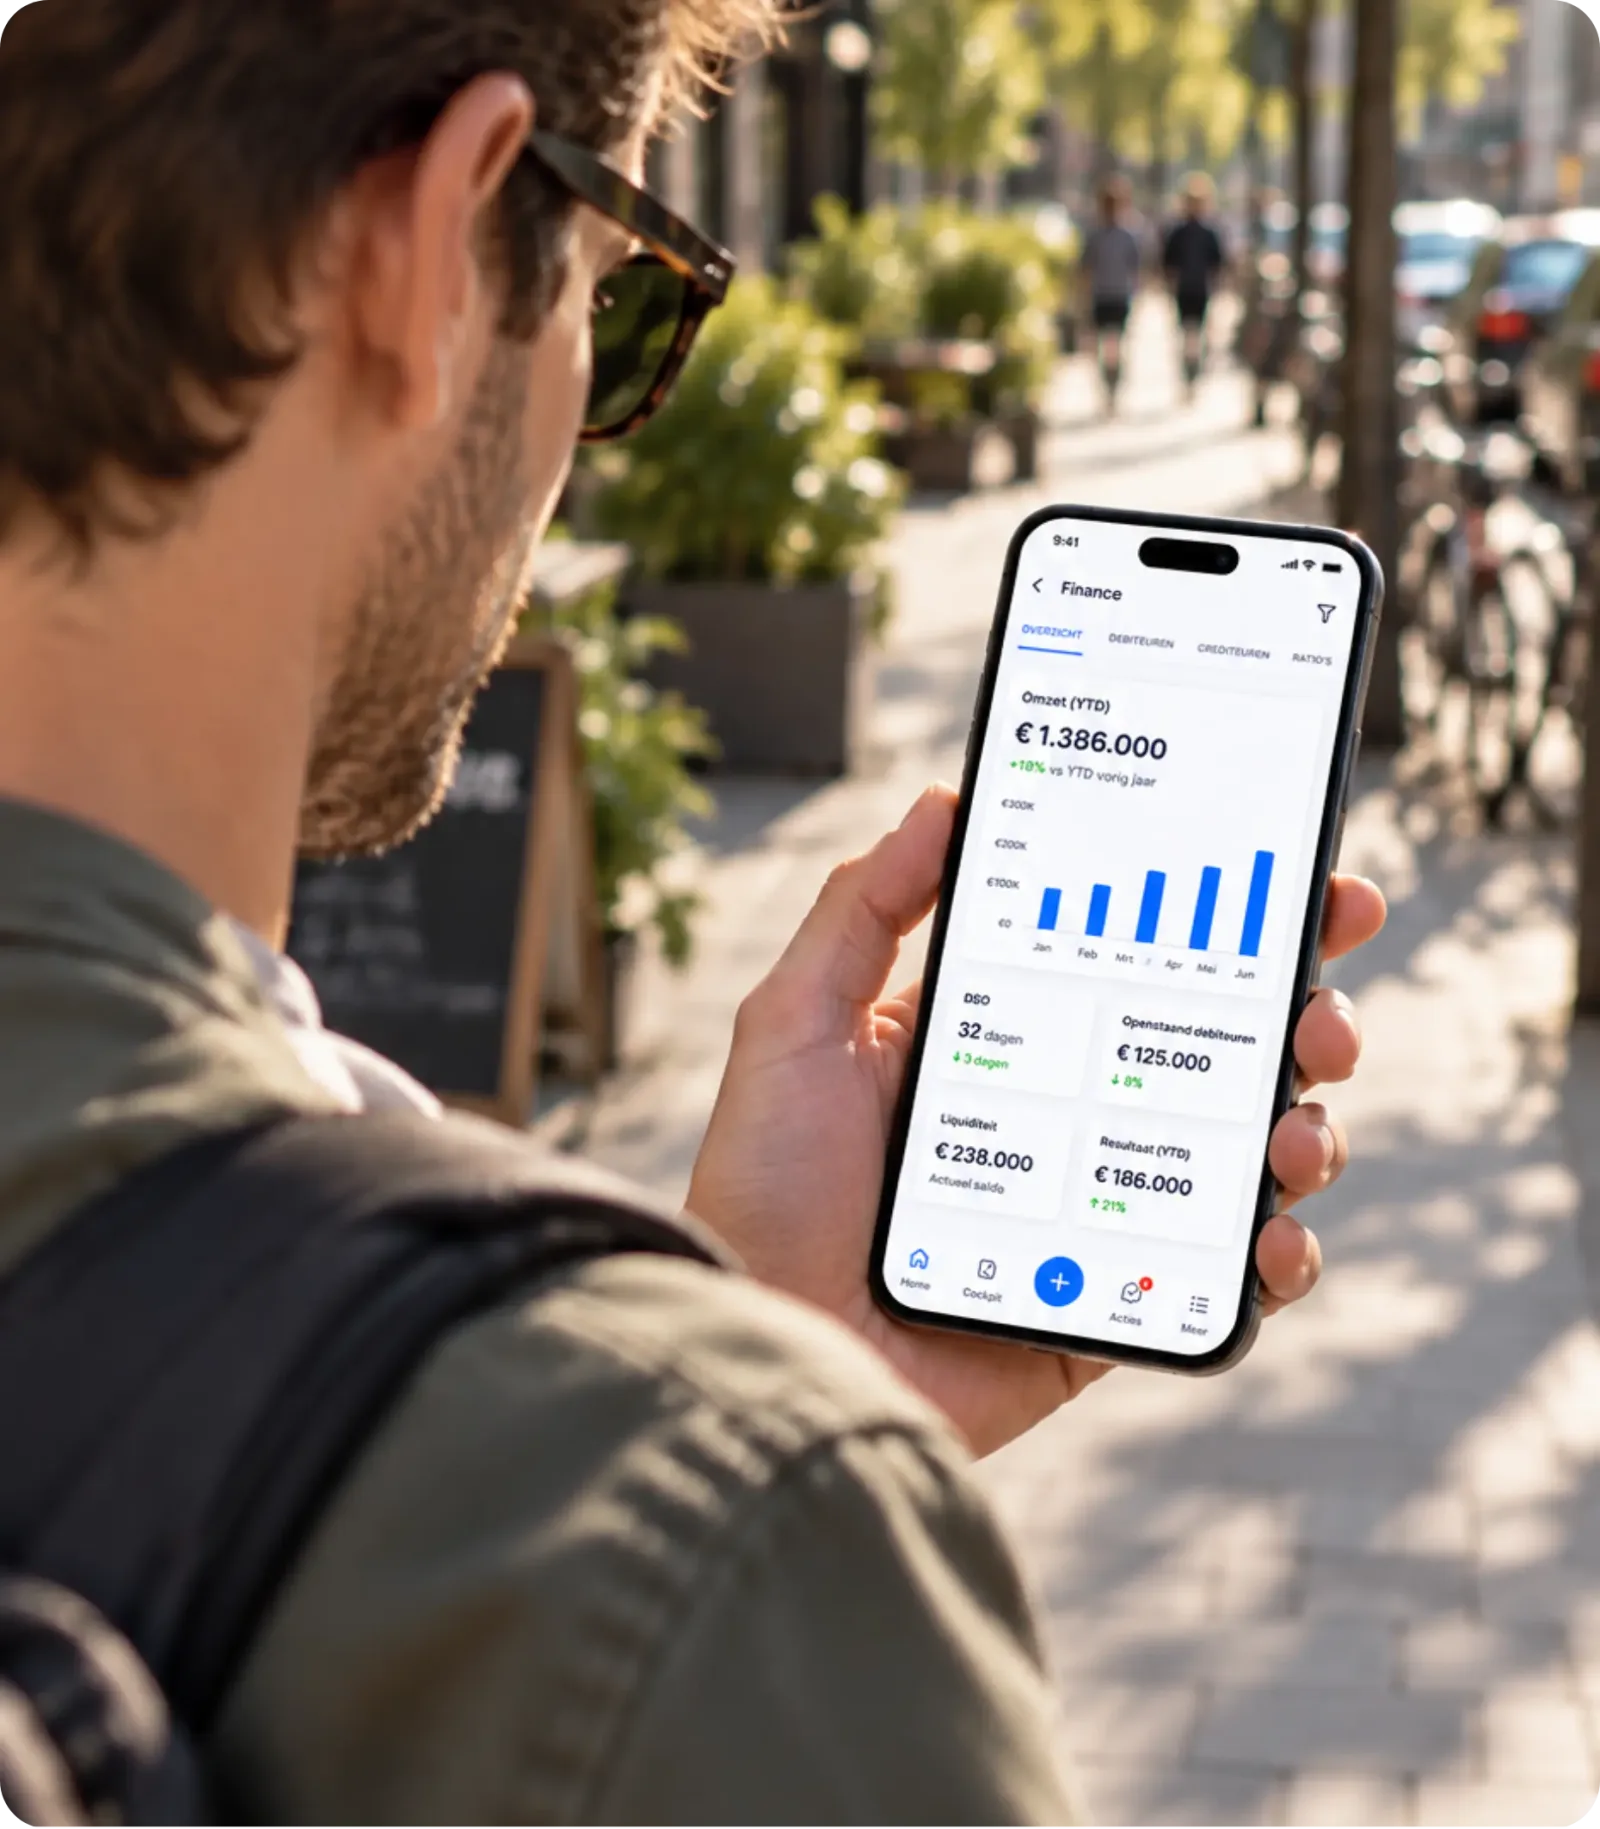
With the Nexora app, you always have your key figures with you. Revenue, margin, cash, and utilization are on your phone, up-to-date, and in the same format as your dashboard. Are you at the bank, with a client, or on your way to a meeting? Then you'll see in a few seconds how things stand, without first calling someone for the latest numbers. If something deviates, Nora sends you a notification. You immediately see what's happening, where it comes from, and who is responsible. You can track open actions from your phone and approve Nora's proposal with one tap, or forward it to the right person. This way, you maintain control of your company, even when you're not at your desk.
Frequently asked questions
Why not just a BI tool or dashboard?
How up-to-date are the figures?
Which KPIs can I track?
Can I also look ahead with Control Tower?
Can I track revenue, margin and labour costs in one dashboard?
Yes. In the Control Tower, revenue, margin, cash, personnel costs, occupancy and absence sit side by side. The figures come straight from your accounting, payroll, HR and CRM. For each figure you set a target and an owner. From a deviating number you click through to the source, and you don't have to wait for the month to be closed. Read also: Tracking revenue, margin and labour costs in one dashboard.